Let’s take a look at performance of 2 websites with a goal to improve it. Let’s use FCP (First Contentful Paint) as a performance metric, which is a core google web vital metric.
Following tools are used to verify website performance and get fix suggestions
- https://pagespeed.web.dev/
- tool that says what potential performance problems a website has
- and my own
performance-explainerwhich aims to explain- what exactly needs to fixed
- what the
ROI(return of investment) of each fix is – to focus on fixes giving the biggest improvement
I’m going to use those tools to see
- What the user perceived performance is
- How to fix performance
Let’s start with website 1
PageSpeed insights website 1
Let’s see what a popular tool says about performance of website https://donorperfect.com. That’s just a sample website that was sent to me during early phase of developing performance explainer to check what is says about performance of this website.
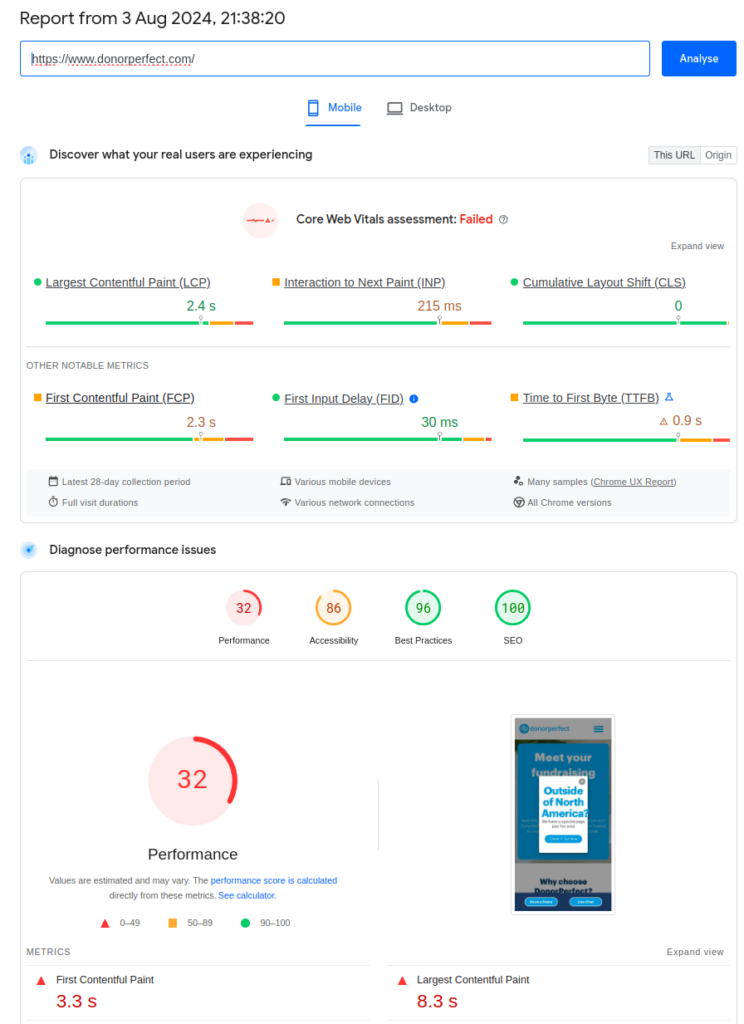
It says overall performance is poor. FCP, which is our focus in this blog post, is scored medium.
Let’s take a look at FCP improvement suggestions from PageSpeed insights.
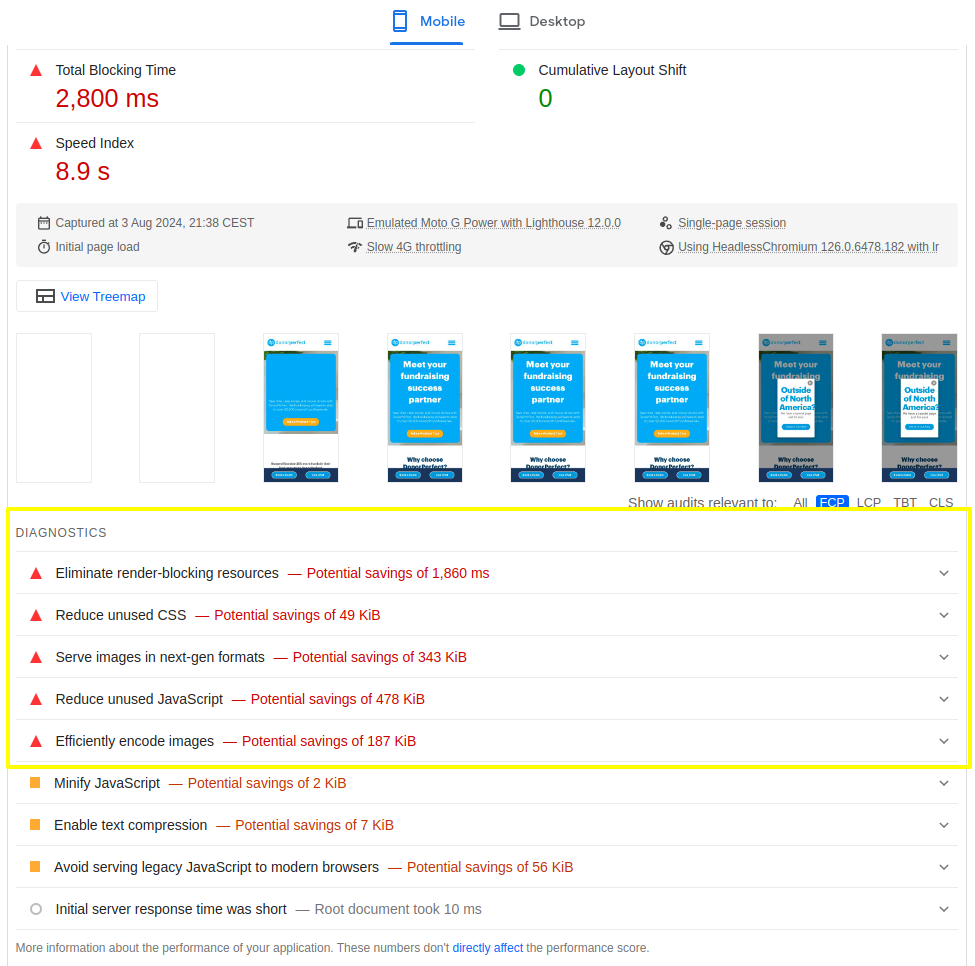
Problem 1: There are render blocking resources slowing down FCP
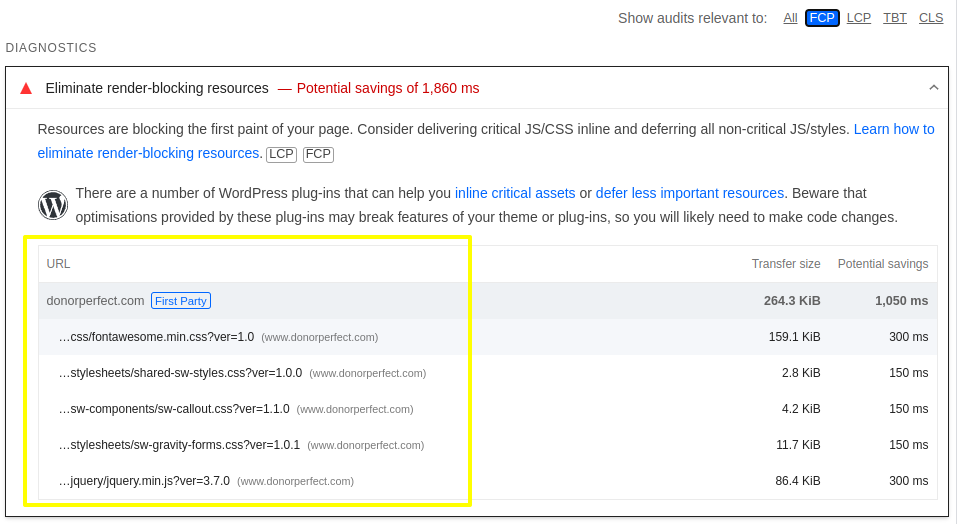
It says potential saving is 1,050 ms. That would be a huge FCP boost and much better use experience when fixes applied!
So as a developer you might think: if I or my team puts an effort to fix blocking resources, performance will be fixed. Right? More on that later 🙂
Problem 2: big images
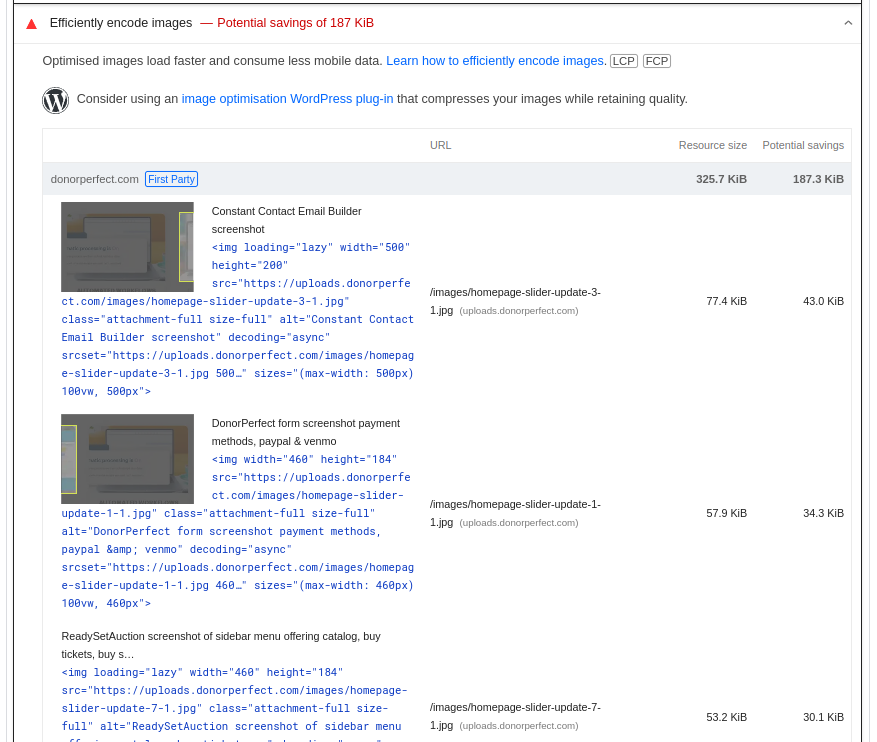
Ok. Looks easy. If images are compressed more, those should be sent faster and should speed up FCP. Right?
At this point a developer trying to improve a website might think:
- It’s clear how to fix performance
- And a there might be a shy thought When I apply the fix, how do I know it really improved
FCP?PageSpeed insightsdoes not aswer this question before the fix.
Is the performance tool job done? Well, if the goal is to actually improve performance, that’s merely a beginning of the job. After the fix developer needs to know if performance was really fixed. That requires measuring the system again. The tool needs to be a part of development cycle.
Hold on. Let’s use much more time effective approach. performance explainer in action
First: take many samples and see what the performance really is.
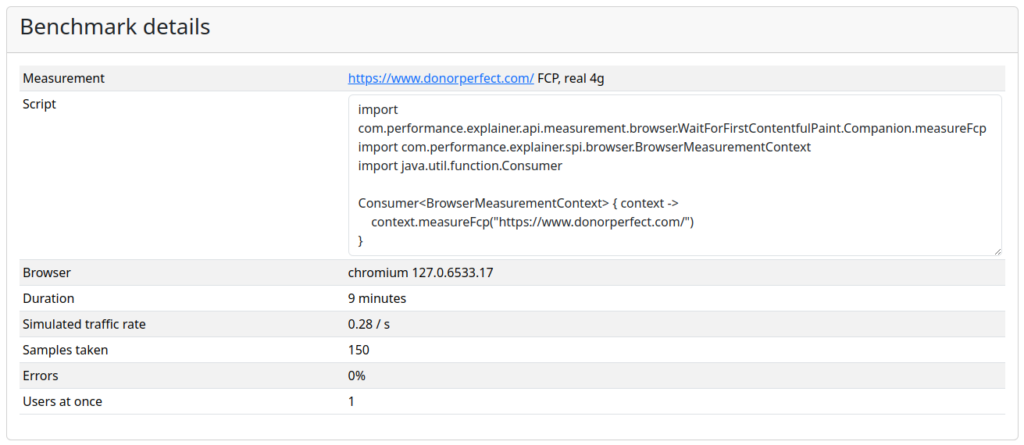
Let’s apply acceptance criteria: For 99% of visits, FCP should be below 1s.
Is it achieved?
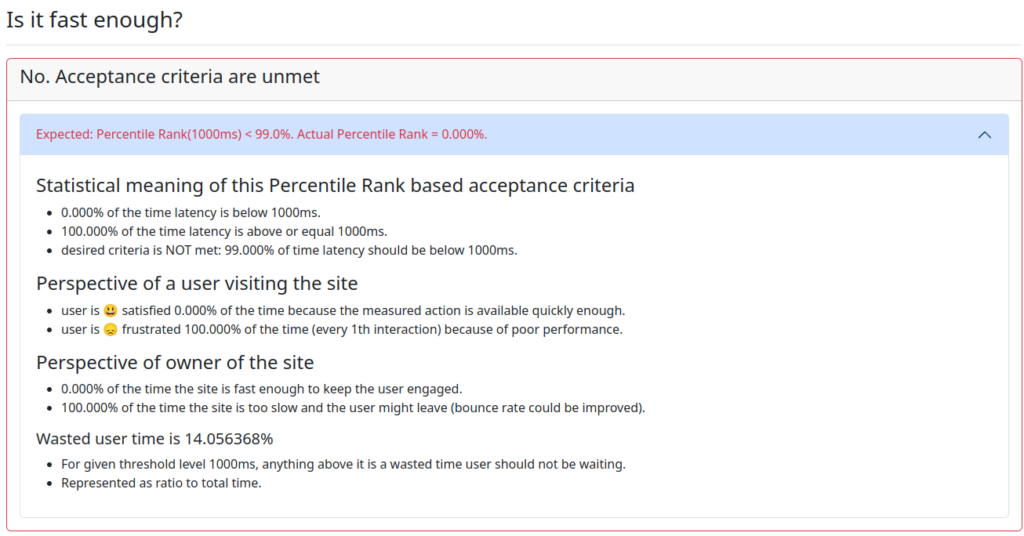
Unfortunately not. Within 150 samples, FCP below 1s was never experienced.
Let’s take a look at FCP across all samples on a percentile chart. What’s the latency user experiences?
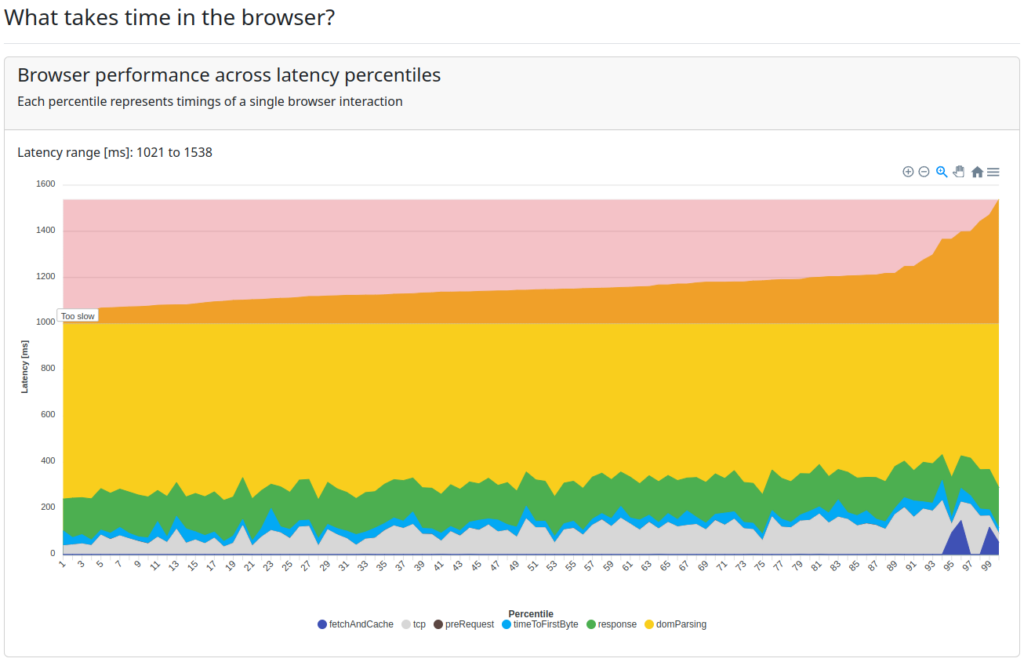
Now you can see the big picture what’s going on at this website. 2.3s as suggested by PageSpeed insights never happened. Maybe PageSpeed insights analyzed samples when that indeed happened?
Let’s apply fixes suggested by PageSpeed insights with a no-code experiments and see if FCP is fixed.
performance-explainer can make a no code experiments in the real browser to answer question: “how much boosting particular requests impacts the measurement?“. In this case – How much will it improve FCP?
So let’s pick requests too boost.
Boost render blocking resources suggested by PageSpeed to simulate the fix without any coding
What if I speed up those requests to a possible maximum? For example, if original request in the browser takes 400ms, it’s possible to cut down the latency in experiment to ~50ms. This way you can see what would happen if you changed the production system.

Ok, go!
A few minutes later the result is ready. 400 baseline measurements (original website) compared to 400 experiment measurements (selected resourced served to browser almost instantly).
What’s the result? Does implementing PageSpeed insights suggestions would fix FCP? No. Developers would work on something that doesn’t improve it

If you speed up those requests by 75-88% those will have no impact on FCP. In production it would mean either actually sending them faster or compressing. Neither would help fixing FCP.
Depending on the product, company and the developers team – fixing performance might take anything from a few hours to a few weeks. So in case of a false signal, a lot of time and money could be wasted.
Another PageSpeed insights hint is to fix images size. Let’s make a no-code experiment and boost sending images
Wha’t the result of boosting images that are supposed to improve FCP?
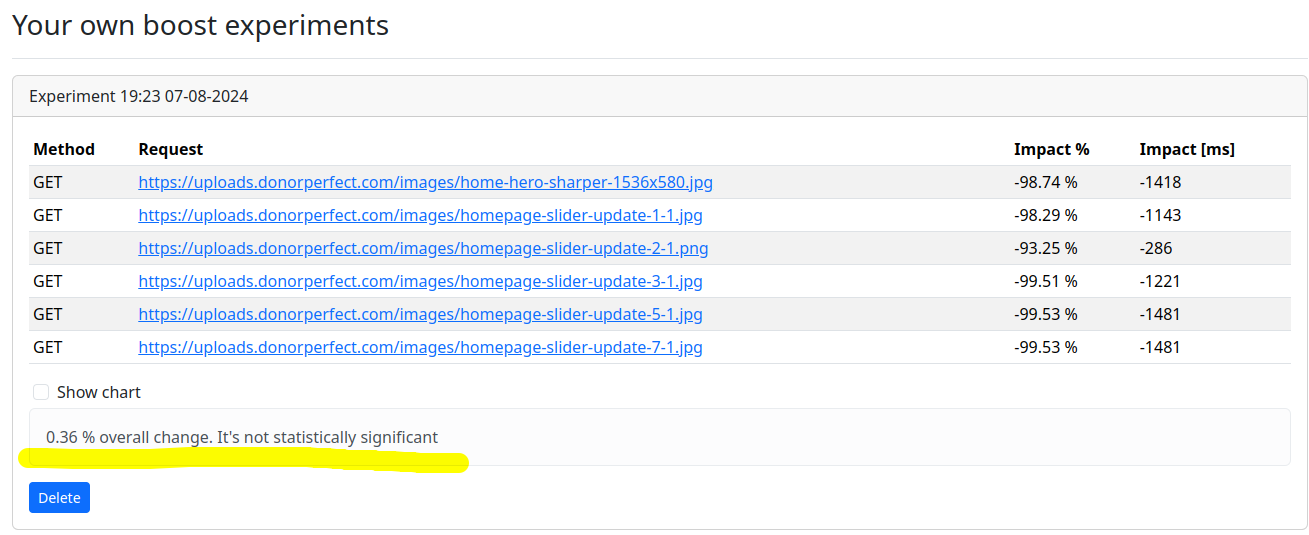
Note images are boosted almost 100%. That means those are almost instantly available for the browser yet it would have no impact on FCP.
Devs would again work on something not improving FCP!
So what will actually improve FCP?
This particular website makes ~120 requests. Which one impacts FCP?
It’s possible to tell with a static analysis. But which one has impact strong enough to make it meaningful and worth fixing?
It’s impossible to tell without statistical analysis based on taking samples from real system. Which means using browser, just like user does.
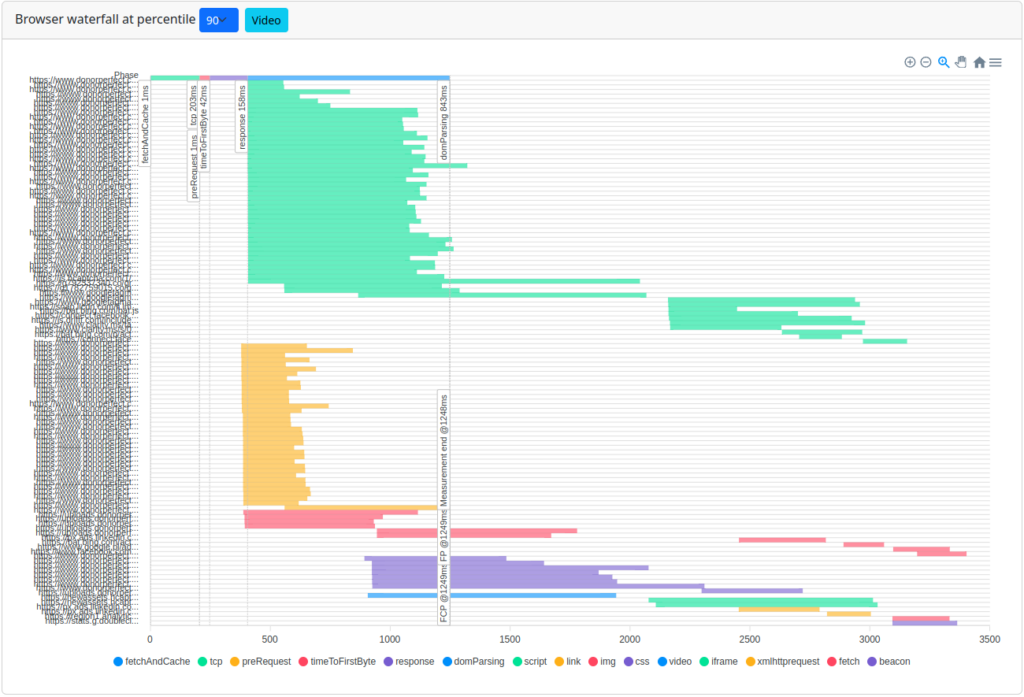
Some of requests are not even ever started before FCP across all samples – that means there are requests very likely to be irrelevant for measurement. But you can’t tell that doing 1 or a few checks. If you take hundreds of samples, you can start making conclusions how tested system really behaves.
“PageSpeed shows suggestions that do not help fixing FCP. What to do now? “
Request boos exploration for the rescue!
I’ve worked really hard to implement request boost exploration in performance explainer.
The methodology is the following:
- For every single request browser makes at given website
- In the real browser simulate request boost up from 10 to 100% (incrementally)
- Take hundreds of samples and apply statistics to see what’s the noise and what’s the true impact
- It’s not using production system, everything happens in the browsers with requests fulfilled with controlled latencies
- Tell if it’s worth speeding up or not
Instead of guessing what to do, let the tooling figure out what’s worth fixing. It might take some time, but the results are accurate.
The lower the measurement latency impact, the better.
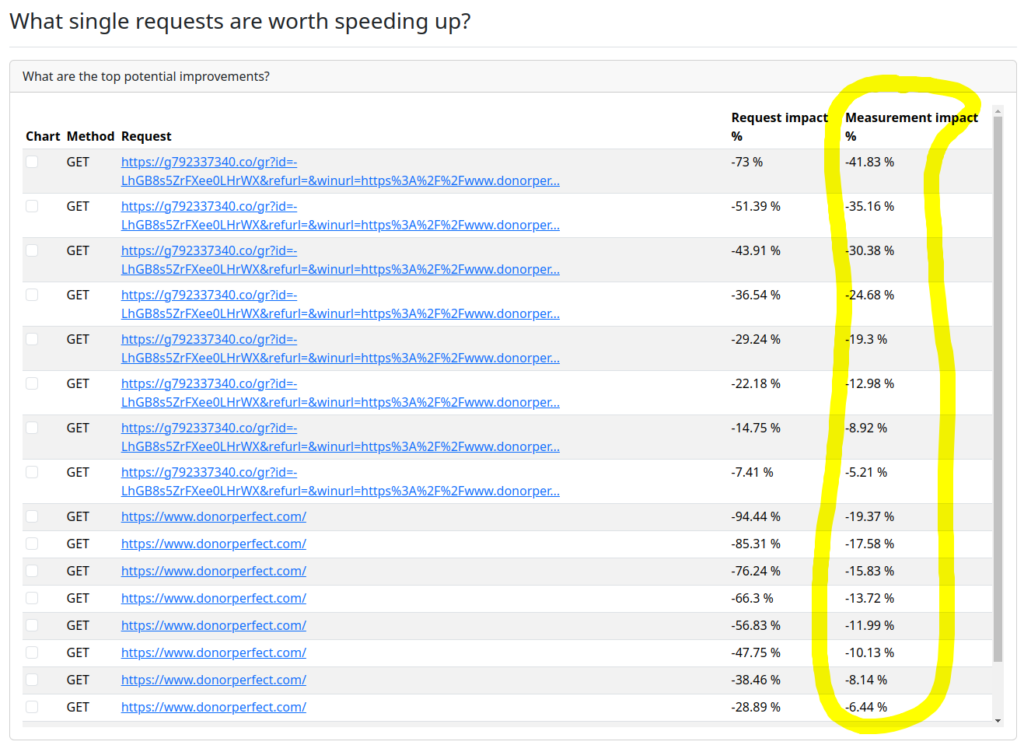
Are those easy fixes? Myabe it’s just a matter of deferring the js resource or making it async. I don’t know. Latency fixes are often difficult. That’s something that now developers can figure out.
Huge part of the job is already done – knowing what to improve. The more first request from above table is sped up, the better FCP is. And that’s where the biggest ROI for improving FCP is. You could also speed up main site, but the ROI there is smaller.
Main focus of this blog post is FCP, but let’s take at LCP (Largest Contentful Paint) also. How to improve it?
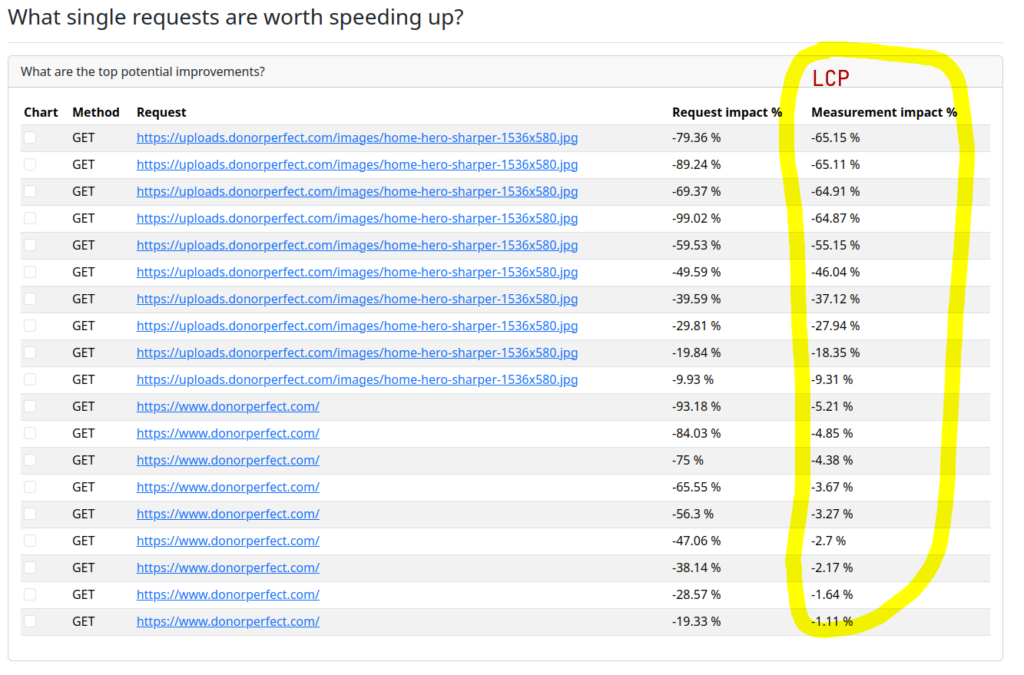
LCP has a different bottleneck. It’s an image, with maximum possible improvement opportunity 65%. What improves LCP might not improve FCP (as in this case). Because it ‘s a different goal.
Note that there is better LCP when image is sped up 80% than 99%. Why? It sounds counterintuitive.
Because there are request races in the browser.
// R1, R2, R3 - browser requests
// R1 is most likely to be a LCP bottleneck

R1 --------------------------------------------
R2 ------------------------------
R3 -------------------------------------

// after enough R1 boost LCP has no further improvements
// now R3 is most likely to be a LCP bottleneck
R1 ----------------------
R2 ------------------------------
R3 -------------------------------------Systems don’t behave deterministic, that’s why hundreds of samples need to be taken. There is a lot of going on in the browser. If you cut off latency of a single request enough, you’re going to see the improvement and after that new bottleneck might be uncovered.
That’s a lo of knowledge, I’m glad you’re still here 🙂
Now let’s move on to
PageSpeed insights: website 2
I feel at the moment of writing my wordpress blog you’re just at is not fast. So let’s just measure it.
What does PageSpeed insight say?
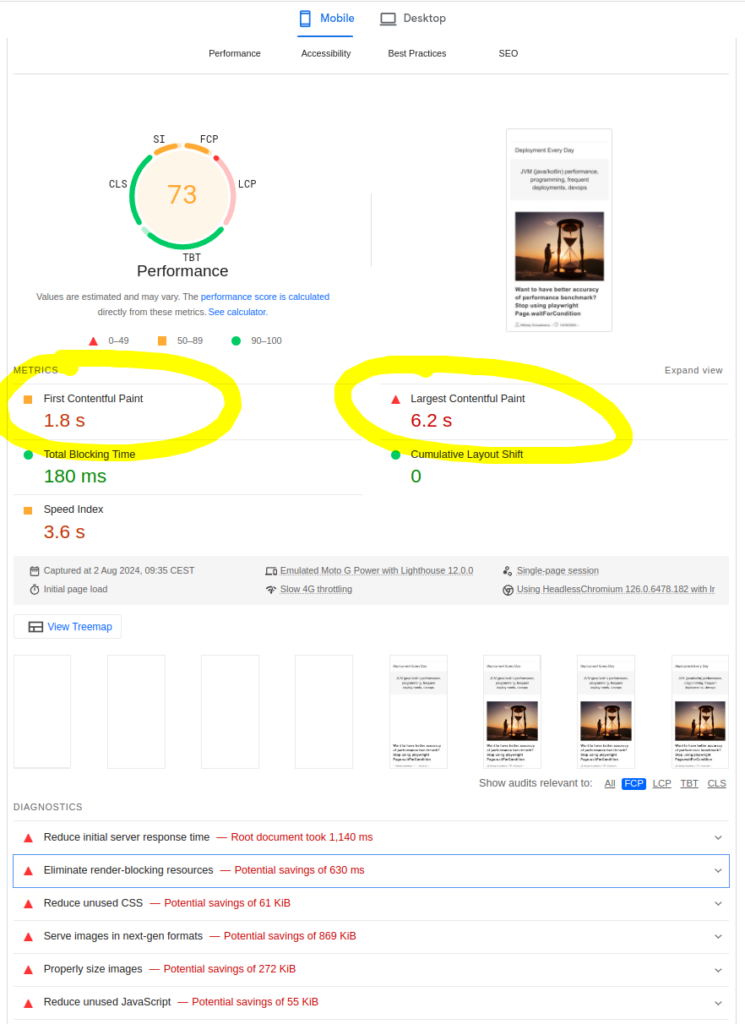
It says 1.8s for FCP, 6.2s for LCP. It could be better.
However does it mean every user experiences FCP 1.8s? Or maybe that’s the worst case? Or the best?
How about fixes?
It points initial server response time could be better as it’s 1 140 ms
- Is it where most improvement can be made? I don’t know but it’s the biggest latency shown on the list.
- Other fixes show potential [kb] savings.
- What does it mean in terms of latency? How much will it improve FCP? Is it worth investing my time to apply fixes there?
I value my time. I need data telling me what should be improved and in what order, not only what’s wrong without even knowing if it will help.
What does performance explainer FCP benchmark say?
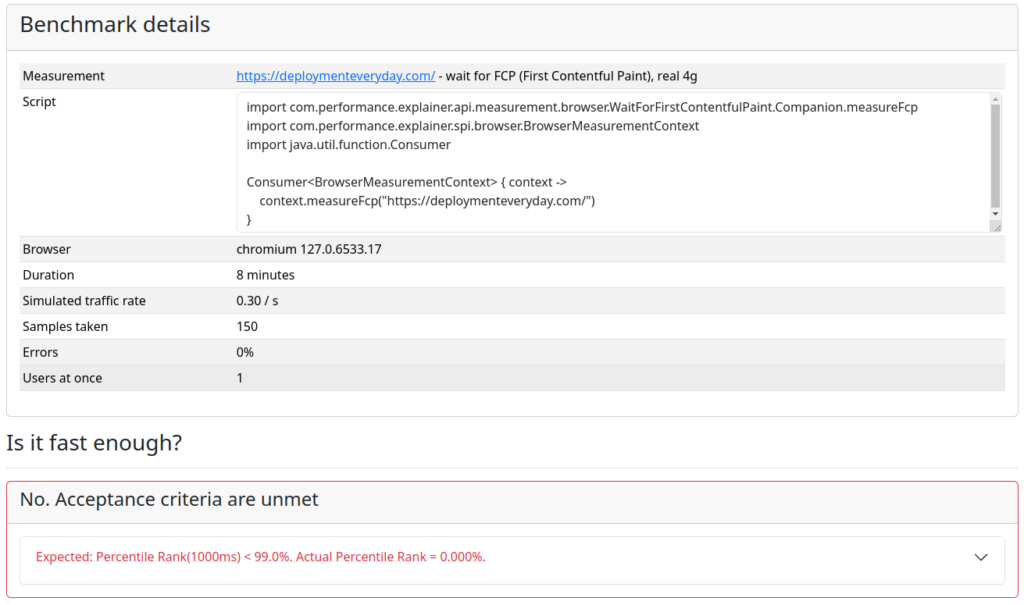
It says user never experiences the desired FCP below or equal 1s.
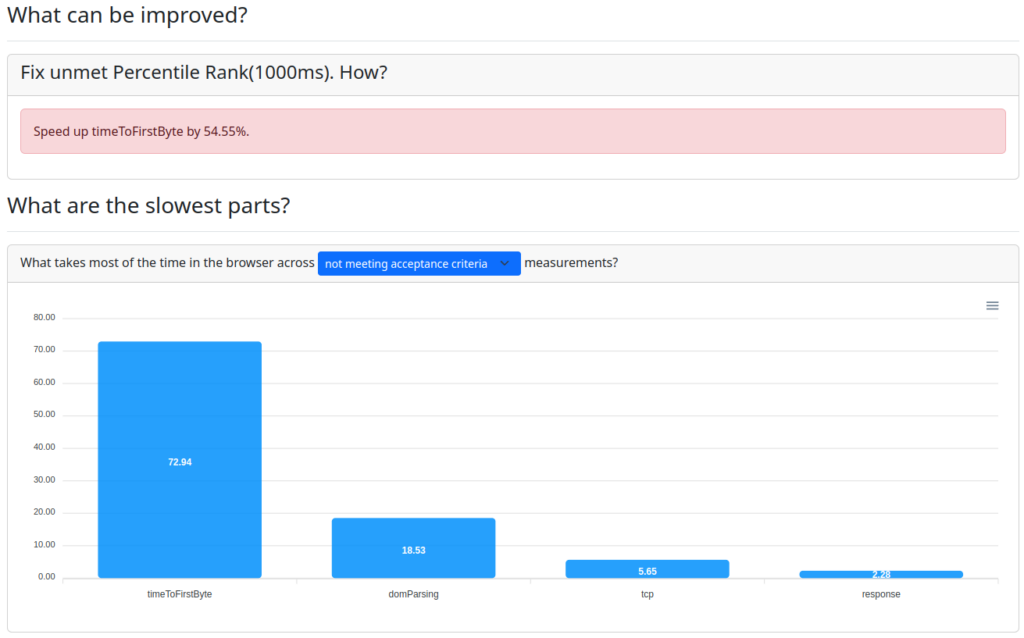
It also says TTFB (Time To First Byte) is where 72% of time user is waiting for FCP and that it needs to be sped up 54.55% to meet acceptance criteria and have 99% latencies below 1s.
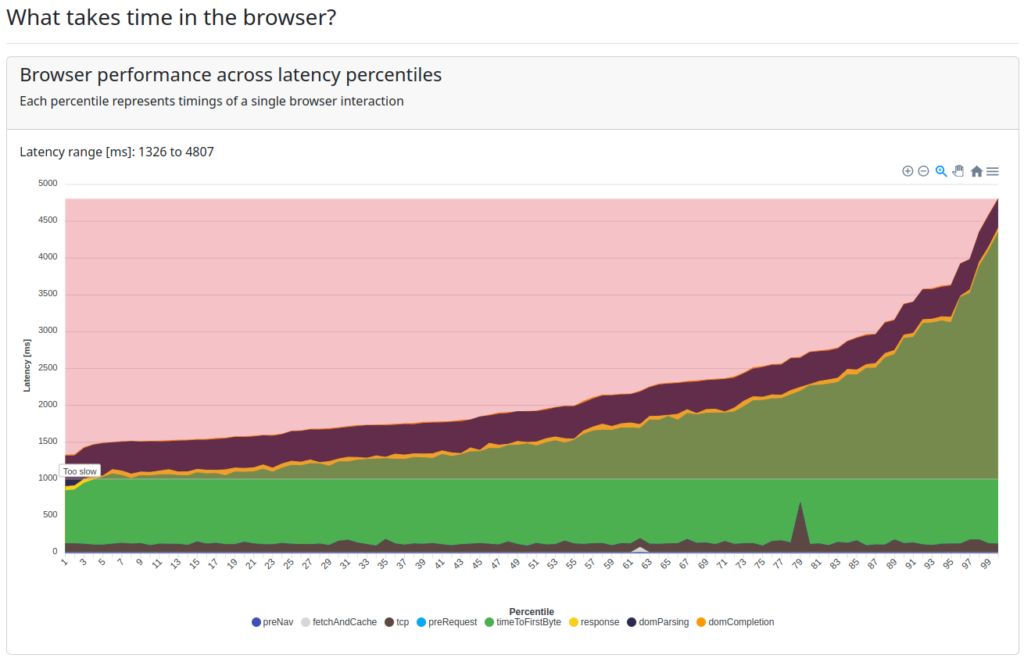
FCP takes from 1326 ms to 4807 ms across 150 measurements. Ouch. I want to give my readers a better experience.
FCP at 1.8s level shown in PageSpeed didn’t look that bad.
So let’s figure out ROIs using request boost exploration in performance explainer
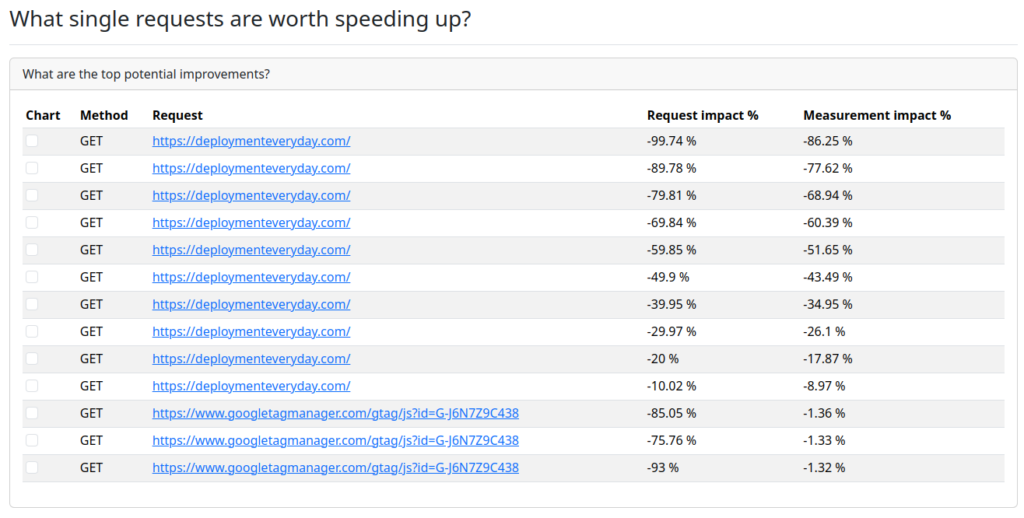
The only fix worth investing is fixing TTFB. Not resources mentioned by PageSpeed insights.
I’m no wordpress expert, but I thought “How about caching the whole response to spend less time on producing HTML? There must be some plugins for caching“
So I installed WP Fastest Cache plugin, turned it on with default settings hoping to improve TTFB which is a bottleneck for FCP. Immediately I had questions in my mind.
- Did it improve performance?
- How would I know it?
- Would refreshing page in the browser give the feeling it’s better?
- What if it gave the feeling it’s better, but if I refreshed the page 10 more times it would actually give feeling it’s worse?
Let the data speak. And what does it say after taking samples and comparing it to samples before installing cache plugin?

FCP did not improve at all. Without measuring it after installing plugin and comparing to baseline (no plugin installed) I’d be pretty sure performance is better. While my readers would feel no difference at all.
Additional plugin would only add complexity to the system. And I would think it’s improving the situation. I removed the plugin immediately.
Now I have more ideas for speeding up TTFB.
- better hosting
- different caching plugin
- different skin
- … and there might be 10 more ideas
However that’s a typical trial and error fixing methodology when no data is available for showing bottleneck in more details.
It’s easy to produce ideas. It’s expensive to implement them. And it’s risky because it might fix nothing.
When you think a fix helped (while it didn’t), unnecessary complexity grows over time. It contributes to a growing production systems maintenance cost.
Since I know the bottleneck is PHP backend, what would really help is to have profiler samples. Or maybe some plugin showing what’s slow on wordpress backend if there is such one.
It would show where time is spent when request is made from the browser. In another words – data allowing understand better the root cause would appear.
If I knew PHP backend bottleneck, there would be no guessing what to fix. As a result
- much quicker fix delivery
- less time spent
- no unjustifiable complexity added for solutions that were supposed to fix performance, while fixing nothing
PageSpeed isights VS performance explainer summary
PageSpeed insights
- It shows improvement ideas. Those look good and worth spending time on
- But in reality those fixes might not fix performance at all
performance explainer
- It’s showing the whole picture and how often user experiences good and bad performance.
- Thanks to to hundreds of samples taken
- it does not present good sounding fixes ideas. It presents the ones that actually impact performance
Do you want to know if your website (on premise product too) is fast enough and having it fixed if needed?
Reach me at mikolaj.grzaslewicz@gmail.com if you want to have performance of your website fixed via consultations. My goal is to have performance explainer available as a service to support more customers.


