If you want to have a simple yet meaningful criteria that answers the question Is my product fast enough? this blog post is for you.
First things first. What’s the goal of a UI measurement?
Who consumes UI? Humans from planet Earth, of course. They get annoyed, frustrated and want to throw away your website out of the window when it’s too slow. They also think very neat things about your product when they are waiting too long.
So the ultimate goal of measuring UI is to know if/what parts of the system should be improved in order to keep users happy.
What question should performance pass / fail criteria answer?
It should answer the question: “Are users happy using my product?“.
Why happy user is that important? And what are consequences of having frustrated users because of poor performance?
You’d better keep users happy by keeping your site fast. Not only you users suffer. Your business suffers. The longer you’re making users to wait, the more
- bounce rate goes up
- you’re losing traffic from organic search as search engine prefers faster sites
- It’s a real deal. I already spoke to people having this particular problem. Google changed the rules (web vitals) and whole team needed to work on performance to bring back lost organic traffic
- and for systems that companies use internally daily
- users will start to look for alternative solutions that frustrate them less
- or have a grumpy-cat face all day
When system passes acceptance criteria it means particular part of your system is fast enough. It means there aren’t too many frustrated users. Product does not need to be fixed in this area.
When system does not pass acceptance criteria it means it’s too slow. Which means there are too many frustrated users. Product needs to be fixed in this area.
What’s the perfect threshold for UI pass / fail acceptance criteria?
0 ms so no one waits for anything 🙂 Jokes aside, let’s see what research says about latencies.
What research says about latency and user frustration
- https://hpbn.co/primer-on-web-performance/#speed-performance-and-human-perception
- Latency longer than 1s causes likely mental context switch. And bounce rate goes up
- And that might be our frustration point
Even if a particular part of your UI is far away from latency 1s, it might be a good, ambitious goal that you can track. Don’t lower the expectations just because system will not pass the criteria. You can always measure the gap to passing the criteria and progress on closing the gap.
Measuring user happiness and frustration is nothing new and it works well
There already are well thought concepts. For example
APDEX
- https://docs.newrelic.com/docs/apm/new-relic-apm/apdex/apdex-measure-user-satisfaction/
- User satisfaction based on T, below which user is satisfied
- 😃 Satisfied, latency
<0, T] - 😐️ Tolerated, latency
<T, 4T] - 😡 Frustrated, latency
<4T, infinity)orerror
- 😃 Satisfied, latency
- Score [0, 1]
- 0 – all frustrated 😡
- 1 – all satisfied 😃
- (number of requests within satisfied range + (number of requests within tolerated range) / 2) / total number of requests
APDEX makes sense. However I will explain percentile rank as even simpler and as powerful concept.
You might have also heard about percentiles, so let’s compare percentiles and percentile rank in practical terms.
Percentiles. Usually P90, P95 or P99
What’s the idea?
Sort the measured latencies array ascending. P90 is index in this array at 90th %.
P90 = latencies[latencies.size * 0.9]
P95 = latencies[latencies.size * 0.95]
etc
Using high percentiles (P90-P99.9) you can find out the slowest latencies user expierence.
Calculating percentiles requires whole population (latencies sorted ascending). It’s not applicable for live monitoring of systems as you have to store every single measured latency.
Percentile rank
Statistical meaning for PR(n)
- How many % of other values are lower than n
- Llike on exam: how many % of other students you’ve beaten with your score
It doesn’t require whole population to calculate, you can count it even on stream. Just increment counter of the passed threshold(s).
Implementation is simple
val badCount = 0
val goodCount = 0
val threshold = 1000
latencies.forEach {
 if (it < threshold) goodCount++ else badCount++
}
val percentileRankPercent = goodCount * 100.0 / (badCount + goodCount)
Why not just use percentiles and P90?
P90 means what's the value at 90%th index of sorted array?
PR(1s) means how many latencies are below 1s?. Not below or equal and that makes the difference.
P90 = 1s doesn’t mean PR(1s) = 90%
Take a look at the example. Given following, sorted array of latencies [s], 10 elements for simplicity
0.25, 0.3, 0.6, 0.6, 0.7, 0.8, 0.85, 0.9, 1.0, 1.4- P90 = 1.0
- PR(1) = 80%
- PR(1.1) = 90%
- PR(1.5) = 100%
Let’s change the example. Latencies got worse, but P90 stays the same
0.25, 0.3, 0.6, 0.6, 0.7, 1.0, 1.0, 1.0, 1.0, 1.4- P90 = 1.0
- PR(1) = 50%
- As you can see, a single percentile does not say how many samples
Let’s change the example. Latencies got even worse, P90 stays the same
1.0, 1.0, 1.0, 1.0, 1.0, 1.0, 1.0, 1.0, 1.0, 1.4- P90 = 1.0
- PR(1) = 0%
As you can see, relying on a single percentile brings a problem. For P90 anything between [0, 90%] of latencies might be as bad as P90.
Percentiles are not designed to answer question how good/bad this latency is?
Let’s construct the pass / fail acceptance criteria based on percentile rank
Based on previously mentioned research and 1s as a user frustration point, let’s construct the acceptance criteria.
PR(1s) is expected to be at least 99%
- Which means “At least 99% of website interactions user should experience latency below 1s“
- Which also means “User can be frustrated by max 1% of website interactions“
What if after a benchmark, criteria is NOT met?
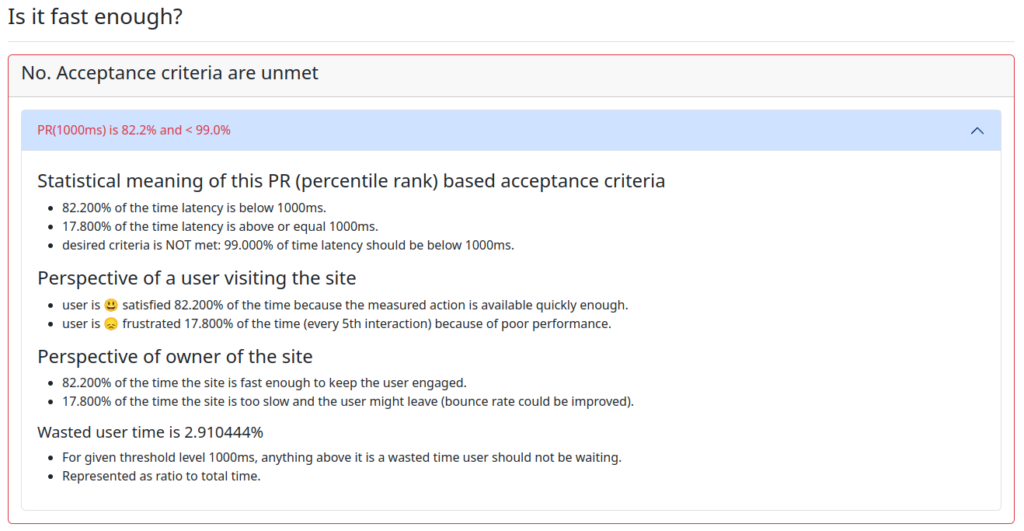
e.g. PR(1s) = 80% and is expected to be at least 99%
It means 19% of the responses are too slow. 19% of interactions needs to be fixed.
How to measure improvement if you start with PR(1s) = 0%
You might be in a situation that all latencies are >= 1s. 100% frustrated user. You want to improve the product by chaning something.
Before change
- PR(1s) = 0%
- All measured latencies are be above 2s
After change, new commits added to the product
- PR(1s) = 0%
- All of measured latencies are above 1.5s. It is an improvement, but percentile rank hasn’t changed.
And you can’t just say “this improvement doesn’t matter, user is still frustrated because criteria measuring user’s frustration is till unmet“. Some improvements require a lot of iterative work and you need a devloop in which you notice the improvement. Even if it’s still far away from having happy user.
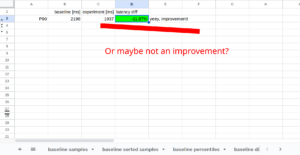
To compare if there is an improvement you could use comparison benchmark with Hodges-Lehmann estimator.
- That requires access to every single latency from baseline and experiment
You could also use a simple measure which I call ‘wasted user time’ which you want to keep at 0.
val thresholdMillis = 1000
val allowedDurationMillis = latencies.size * thresholdMillis
val totalDurationMillis = latencies.sumOf { it.toMillis() }
val excessiveDurationMillis = totalDurationMillis - allowedDurationMillis
val wastedUserTimePercent = excessiveDurationMillis * 100.0 / totalDurationMillis
This way even if percentile rank hasn’t changed you can still measure the improvement.
And that’s the exact methodology I’m using to measure webpages performance and answer questions “how to improve the system?”


