Let’s start with a necessary definitions: what are DOMContentLoaded and load events in the web browser?
DOMContentLoaded
According to docs when browser fires this event it means
- DOM has been completely parsed
<script defer src="…">and<script type="module">has been loaded- async script, images, frames might not be loaded yet
load event
When browser fires load event it means DOM content is fully loaded. Browser has finished
- executing all asynchronous resources from the DOM tree
- loading images, frames etc.
- it comes always after
DOMContentLoaded
Both events are NOT about REST calls. And both are not relevant to the user browsing the website.
What do web apps automation tools like playwright and selenium do by default?
Take a look at following lines of code measuring navigating to a page and waiting for a button to be visible.

using playwright
val millisBefore = System.currentTimeMillis()
page.navigate("https://github.com")
page.getByText("Try Now").waitFor()
val latency = System.currentTimeMillis() - millisBefore
or doing the same with selenium
val millisBefore = System.currentTimeMillis()
driver.navigate().to("https://github.com")
WebDriverWait(driver, 30, 100).until(ExpectedConditions.visibilityOfElementLocated(By.linkText("Sign up for GitHub")))
val latency = System.currentTimeMillis() - millisBefore
When you navigate to a page, by default those automation tools wait for load event. So the line with locator is not executed until then.
You might think Pff, so what. It’s just a technical detail
It is indeed a technical detail but it impacts performance benchmark dramatically.
Waiting for DOMContentLoaded VS load VS NOT waiting for any event. Fight!
Let’s measure how quickly user can see github call to action button.
Baseline benchmark – wait for load event
Take 1000 samples. Wait for load event, then wait for github call to action button
// only most important code shown here. Processing measurements is out of the scope
page.navigate("https://github.com")
page.getByText("Sign up for GitHub").first().waitFor(WaitForOptions().setTimeout(2000.0))
It looks like this
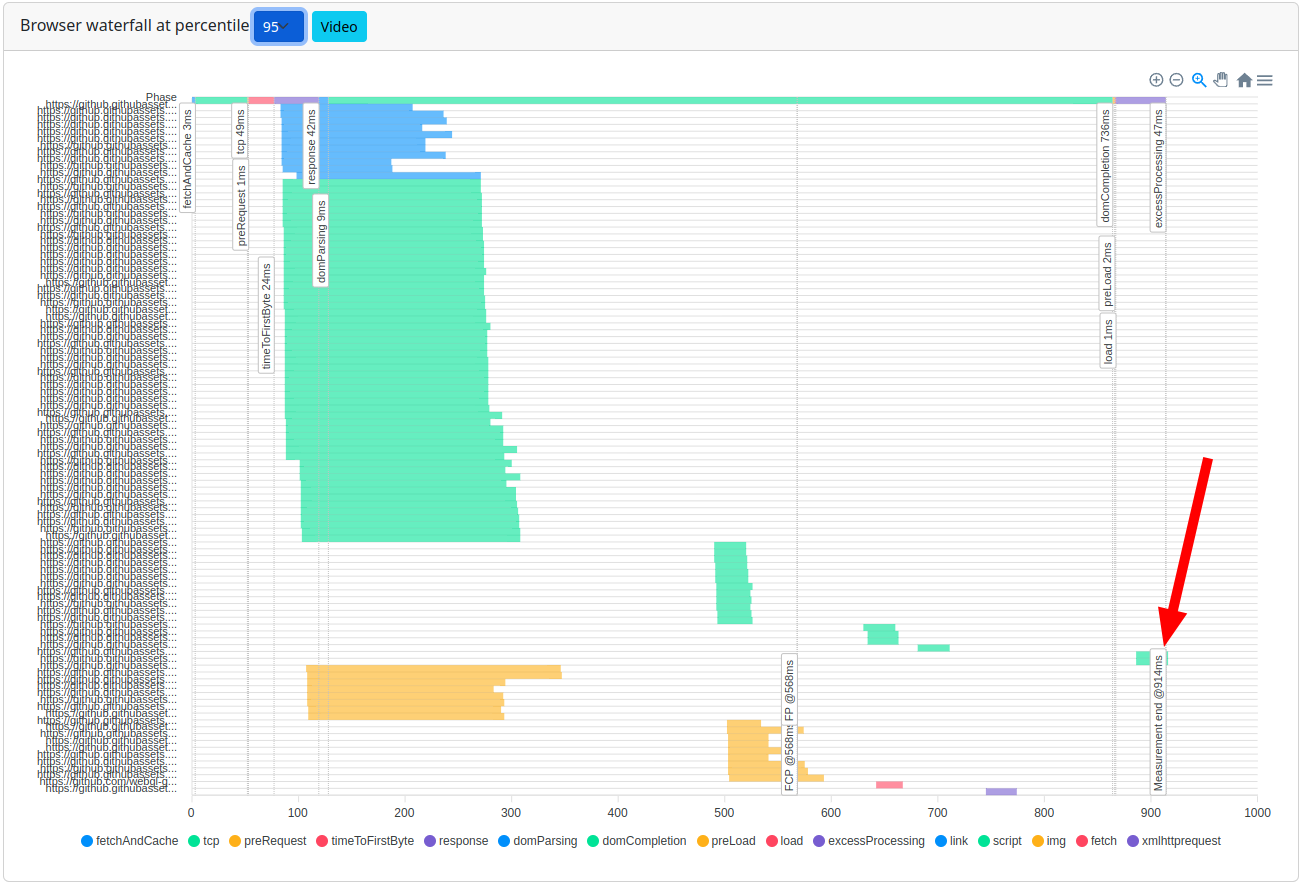
load event` at percentile 95, button measured as visible after 914 msHow to interpret the video of web app measurement?
Playwright video recording is imperfect. Video frame is often not aligned with what was seen in web browser. I confirmed that with modifying the measured page after measurement end.
During recording web app, right after measurement end timer is added to the page. This way it doesn’t interfere with measurement and helps to see when measurement has actually finished on the video.
const measuerementEndMillis = ..; // depends on the measuerement
const timerDiv = document.createElement('div');
timerDiv.style.position = 'fixed';
timerDiv.style.top = '0';
timerDiv.style.left = '0';
timerDiv.style.opacity = '0.8';
timerDiv.style.fontSize = '14px';
timerDiv.style.backgroundColor = 'yellow';
timerDiv.style.zIndex = '10000';
document.body.appendChild(timerDiv);

setInterval(function() {
  const now = performance.now();
  timerDiv.textContent = now.toFixed(0) + ' ms, ' + (now - measurementEndMillis).toFixed(0) + ' ms';
}, 20);
X – milliseconds since time origin (page started loading)
Y – milliseconds since measurement end. Timer is added after locator is satisfied so it doesn’t disturb the measurement
When measuring very fast page like github.com landing page, you’re often going to see a blank page and right after that frames recorded some time after measurement end (signup button visible). Frames are lost. Based on that you should treat every moment of playwright video as possibly inaccurate.
Having said that, let’s move on.
load event at percentile 95, button measured as visible after 914 ms. Mind the significant part of the video with button visible, yet measurement is not finishedExperiment benchmark 1 – no waiting
Take 1000 samples. Don’t wait for any event, wait for github call to action button
import com.microsoft.playwright.Page.NavigateOptions
import com.microsoft.playwright.options.WaitUntilState.COMMIT

// from playwright docs WaitUntilState.COMMIT:
// consider operation to be finished when network response is received and the document started loading
page.navigate("https://github.com", NavigateOptions().setWaitUntil(COMMIT))
page.locator("#summary-val").first().waitFor()
In selenium you have to opt out from waiting for DOMCompleteEvent this way
val options = new ChromeOptions()
options.setPageLoadStrategy(PageLoadStrategy.NONE)
val driver = new ChromeDriver(options)
driver.navigate(..).to()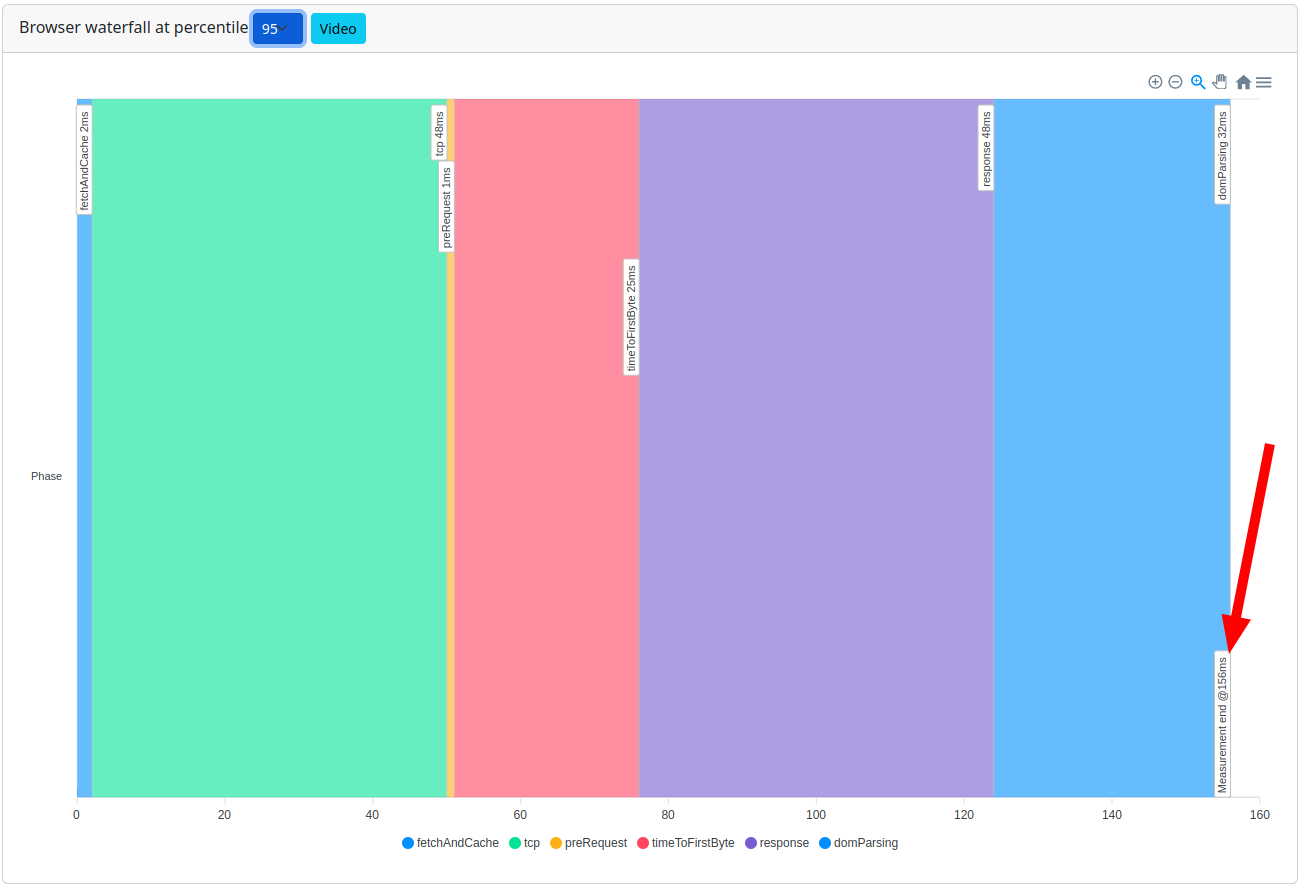
Experiment benchmark 2 – wait for DOMContentLoaded event
Take 1000 samples. Wait for DOMContentLoaded, wait wait for github call to action button
import com.microsoft.playwright.Page.NavigateOptions
import com.microsoft.playwright.options.WaitUntilState.DOMCONTENTLOADED

// from playwright docs WaitUntilState.DOMCONTENTLOADED:
// consider operation to be finished when the DOMContentLoaded event is fired.
page.navigate("https://github.com", NavigateOptions().setWaitUntil(DOMCONTENTLOADED))
page.locator("#summary-val").first().waitFor()
In selenium you have to opt out from waiting for DOMContentLoaded event this way
val options = new ChromeOptions()
options.setPageLoadStrategy(PageLoadStrategy.EAGER)
val driver = new ChromeDriver(options)
driver.navigate(..).to()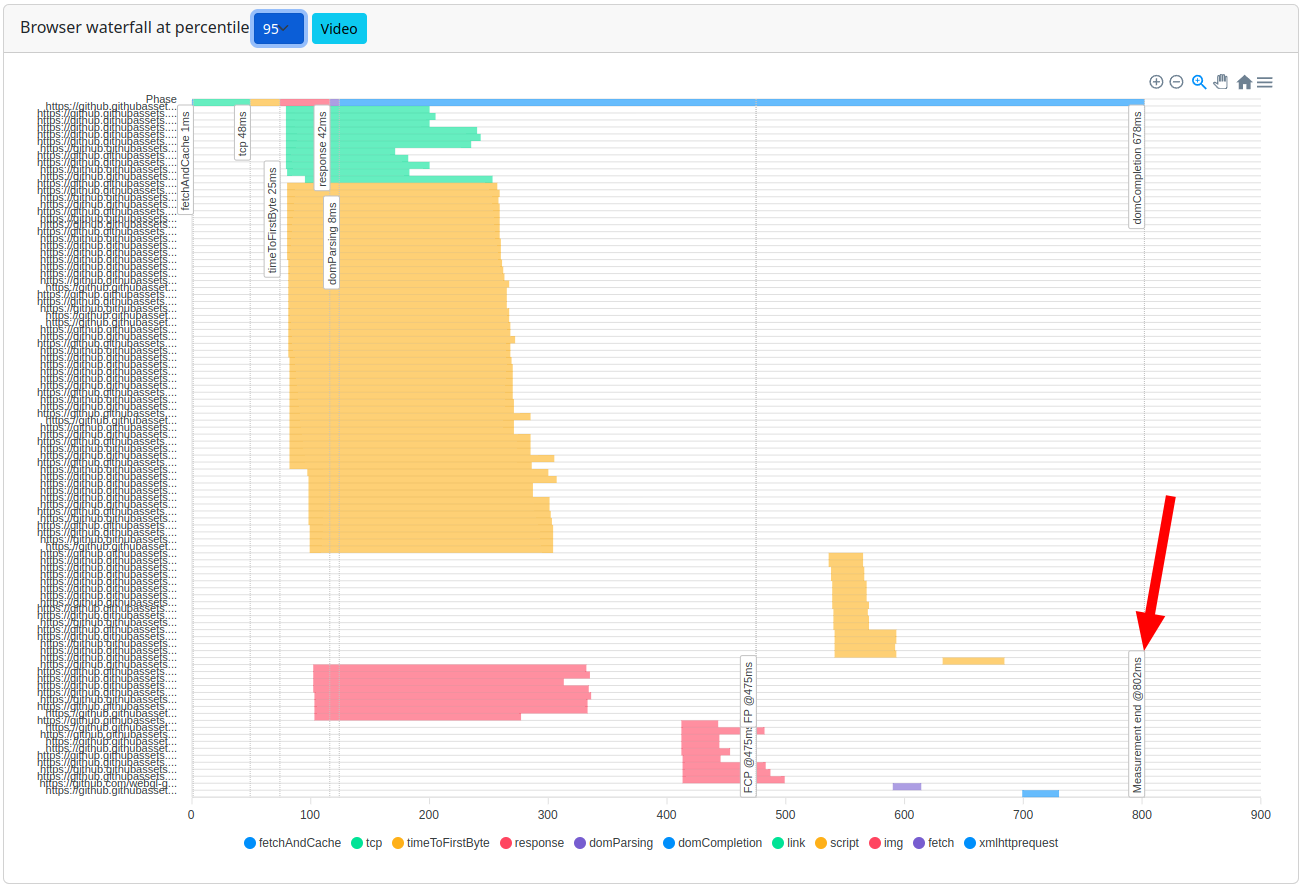
DOMContentLoaded event at percentile 95, button measured as visible after 802 msDOMContentLoaded event at percentile 95, button measured as visible after 802 ms. Mind the significant part of the video with button visible, yet measurement is not finishedAnd now let’s compare the results
P95 comparison
| no waiting | wait for DOMContentLoaded | wait for load event |
| 156 ms | 802 ms | 914 ms |
Percentiles do not answer the question how distribution compares? Down the line you’re going to see Hodges-Lehman estimator
What hypotheses are we verifying here?
loadevent- (baseline) null hypothesis: waiting for
loadevent has completion has no performance impact - (experiment 1) alternative hypothesis: waiting for
loadevent has impact on measured latencies
- (baseline) null hypothesis: waiting for
DOMContentLoadedevent- (baseline) null hypothesis: waiting for
DOMContentLoadevent has has no impact on measured latencies - (experiment 2) alternative hypothesis: waiting for
DOMContentLoadevent has impact on measured latencies
- (baseline) null hypothesis: waiting for
Waiting for load event VS not waiting for any event

Title of this blog post says there is 530% performance degradation when you rely on browser automation defaults. So where is it? When you reverse baseline VS experiment, there it is

load event comes with bigger latenciesNull hypothesis is rejected, waiting for load event comes with bigger latencies

Waiting for DOMContentLoaded VS not waiting for any event

Null hypothesis is rejected, waiting for DOMContentLoaded increases measured latencies
Waiting for DOMContentLoaded VS waiting for load event
Having 2 experiments we can compare them too. Since load event comes always after DOMContentLoaded it’s expected to see bigger latencies which is reflected in measurements

Based on measurements, what are undesired effects of waiting for DOMContentLoad or load event?
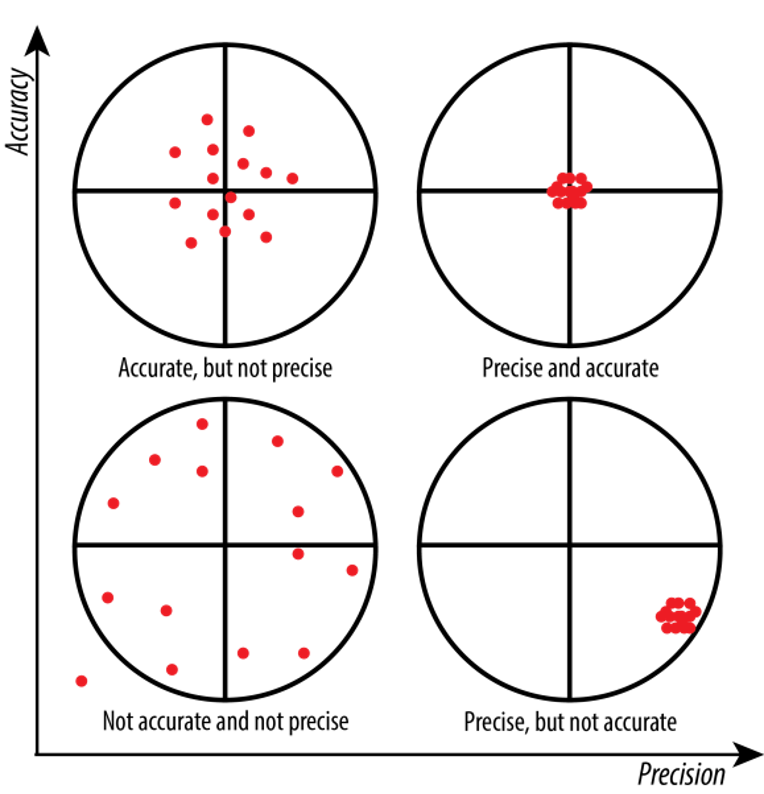
- To understand better following part take a look at difference between accuracy and precision
- The undesired effects
- Measuring something neither reflecting user experience nor relevant to user experience. User sees a button and clicks a button regardless of events in the browser
- No user ever thought “I politely wish this site had dom completion faster“. User thinks “Why the f^%@ is this button not working yet?!!??“
- (much) longer benchmarks
- for ones that aim for measurement count, e.g. we want to have 200 samples
- Less precise benchmarks
- for ones that aim for duration, e.g. running for 10 minutes
- because you will get less samples
- Less accurate benchmarks
- because you’re not measuring what user experiencies
- As a result system under benchmark might actually meet some acceptance criteria, while measurements show it’s not
- Disturbs calculating correlations and figuring out frontend latency causation
Side effects of not waiting for DOMContentLoaded or loaded event
User can click a visible button, that does not react on clicks yet. Which actually is a reality 🙂
However that complicates measurements. Frameworks do not check if a button has event listeners. It often requires polling for a desired button state. e.g. await condition click and check if expected message is visible
Summary
I’ve taken thousands of measurements of a few different sites, not only github. Systems behave the same. Waiting for browser events makes measured latencies inaccurate. It might be 10% away from real user experience, it might be 530%.
It’s non-zero, reproducible and deterministic. So if you already made an effort to make synthetic performance benchmarks, I’d recommend putting an effort also in increasing their accuracy.
Consider changing default options for browser automation
For playwright and selenium (and whatever browser automation tools there are) you should opt out from waiting for any browser events if you’re using those tools for performance measurements.
| Option | Selenium | Playwright |
| wait for response received (best for performance benchmarks) | NONE | COMMIT |
| wait for load event (default) | NORMAL | LOAD |
| wait for DOMContentLoaded event (another option) | EAGER | DOMCONTENTLOADED |



Great reference material! The devil is in the details and they don’t teach this deep on courses 😉