40x performance improvement in this example is series of a few improvements combined.
I was trying to check what can be improved during working on a small project. As usual, I run intellij profiler from time to time to see the hottest methods. And that was part of my development workflow aside from TDD.
2x speedup – remove String.format() usage (technical optimization)
Remove usage of String.format("Move index %s from %s to %s", indexFrom, listFrom, listTo);
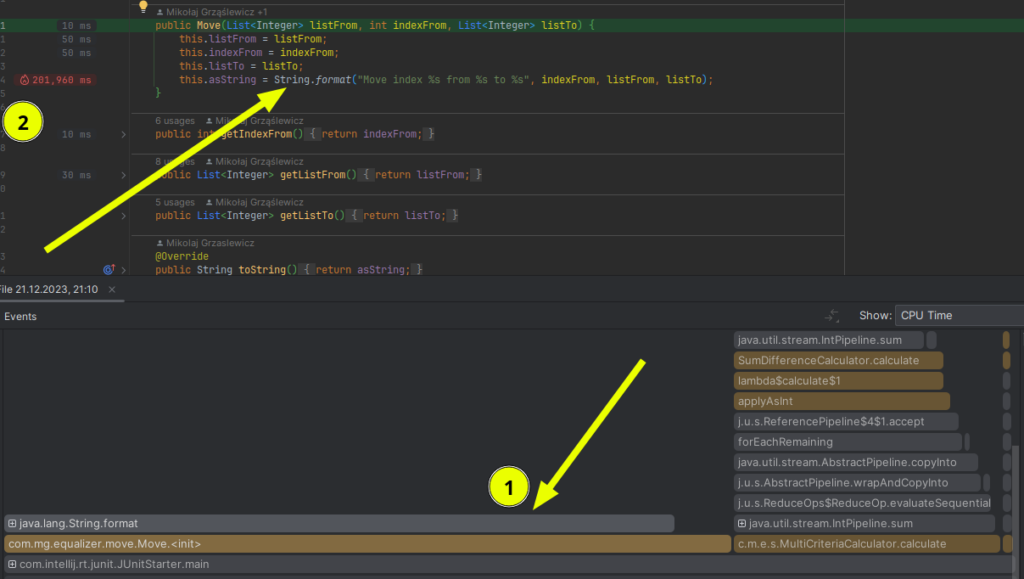
It’s not surprising it was slow, but discovering that is not obvious. Imagine you’re introduced to a new, big project – there is no way you would eyeball the code and say this is a bottleneck (hot method)
10x speedup – replace streams with for each (technical optimization).
Replace
return calculators.stream().mapToInt(c -> c.calculate(listA, listB)).sum();
With
  int sum = 0;
  for (var calculator : calculators) {
      sum += calculator.calculate(listA, listB);
  }
  return sum;
Bottleneck (hot method) found
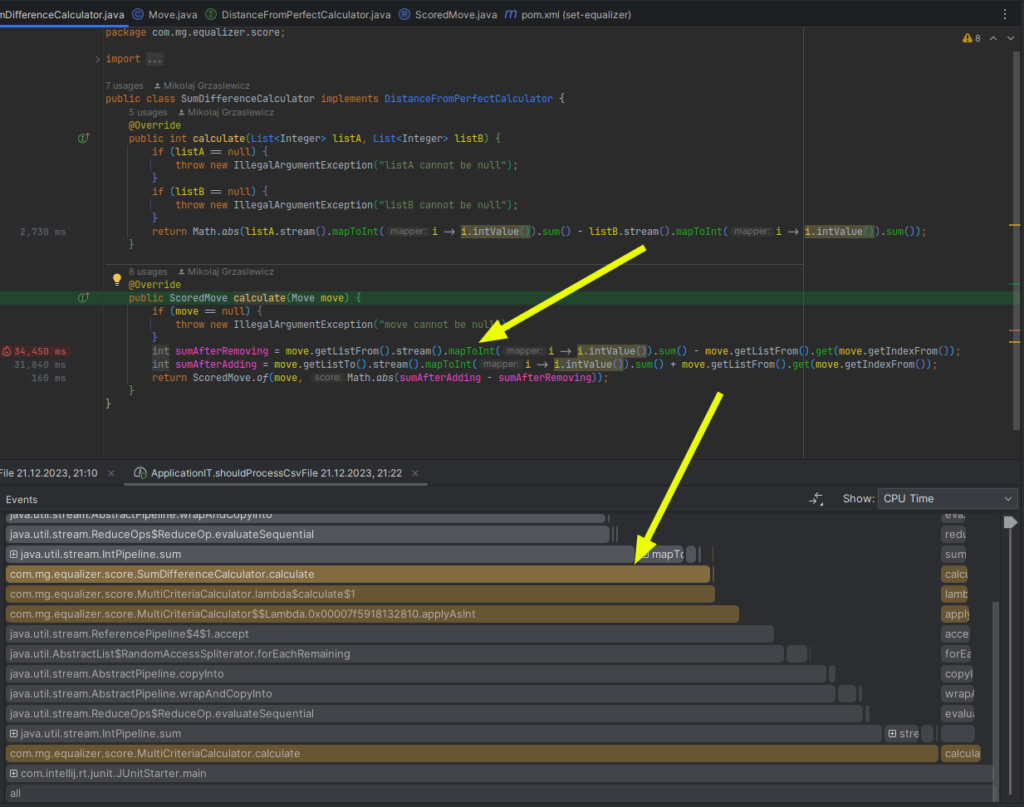
2x speedup – add sum caching (technical optimization).
Replace
  private int sum(List<Integer> list) {
      int result = 0;
      for (var i : list) {
          result += i;
      }
      return result;
      return Math.abs(listA.sum() - listB.sum());
  }
With a sum caching java.util.List decorator
  public class SumCachingList implements SummingList {
      private final List<Integer> decorated;

      public SumCachingList(List<Integer> decorated) {
          this.decorated = decorated;
      }

      private int sum;
      private boolean sumCalculated = false;

      @Override
      public int sum() {
          if (!sumCalculated) {
              calculateSum();
              sumCalculated = true;
          }
          return sum;
      }

      private void calculateSum() {
          for (var i : decorated) {
              sum += i;
          }
      }

      @Override
      public boolean add(Integer integer) {
          sum = sum() + integer;
          return decorated.add(integer);
      }

      @Override
      public boolean remove(Object o) {
          var removed = decorated.remove(o);
          if (removed) {
              sum = sum() - (Integer) o;
          }
          return removed;
      }

     @Override
     public boolean removeIf(Predicate<? super Integer> filter) {
         var anyRemoved = decorated.removeIf(filter);
         if (anyRemoved) {
             sumCalculated = false;
         }
         return anyRemoved;
     }

      // ...
  }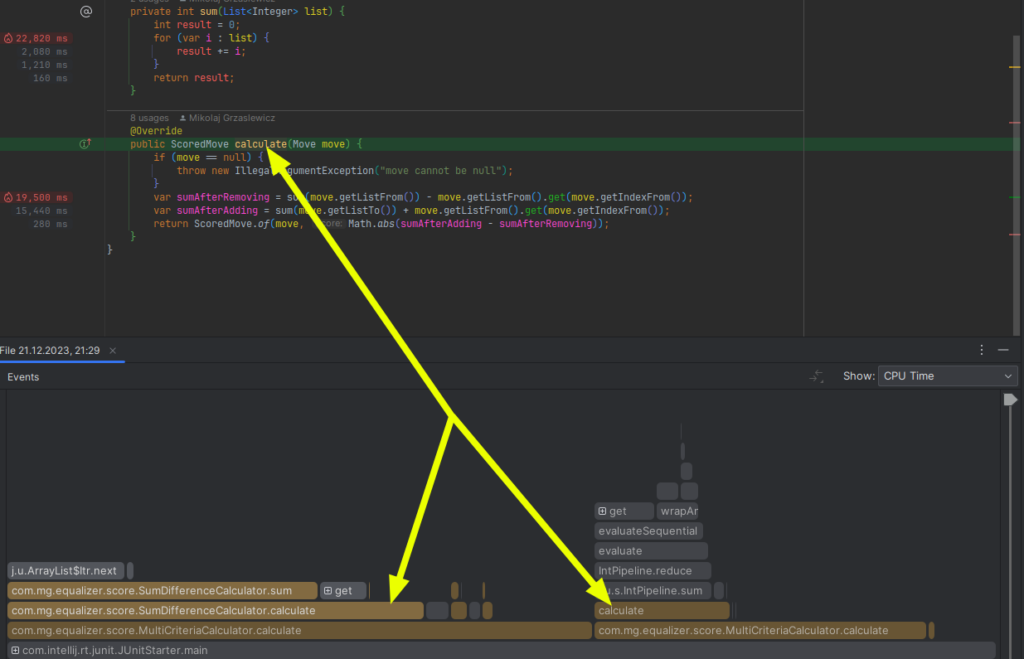

After above optimizations flamegraph looks like that

Big picture optimisation VS technical optimisation
Ok, now you see that you can discover bottlenecks using async profiler recording. Above example is rather an easy one. For huge systems with tons of legacy code which is hard to maintain and change, it might be really hard.
Even discovering slow parts of big systems is hard, but that’s a topic for another blog post.
Technical optimizations are often easier to find.
Technical optimization
You don’t necessarily have to understand what the application is doing. You can read straight from the flamegraph that adding a cache or optimizing loops is going to help.
Big picture optimisation
You need to understand what your application is doing. You can optimize by organizing processing in a different way, e.g. discovering that you don’t have to fetch and process some data to in order to display particular piece of frontend.
Run integration tests with profiler regularly
That should be part of your development process. Like running integration tests.
In a perfect case, scenario of integration test should be as similar as possible to production scenario. This way you’d discover potential performance improvements or issues before production deployment.
Know the difference between async profiler sampling modes: Wall Clock and CPU usage only
Wall Clock (Total Time)
If you’re interested in real latency of your system, including
IO, e.g.
- connection polling
- DB transaction locks
- reads/writes
synchronization, e.g.
- waiting for critical section access
- waiting for tasks in a thread pool
use Wall Clock sampling in async-profiler. This mode will collect events from threads in SLEEPING state also.
Beware it affects performance of measured process more than measuring only ACTIVE threads. Why? Because measured JVM has more threads to iterate over every interval.
CPU only
In other words, without Wall Clock mode, measuring sampling only JVM threads in ACTIVE state
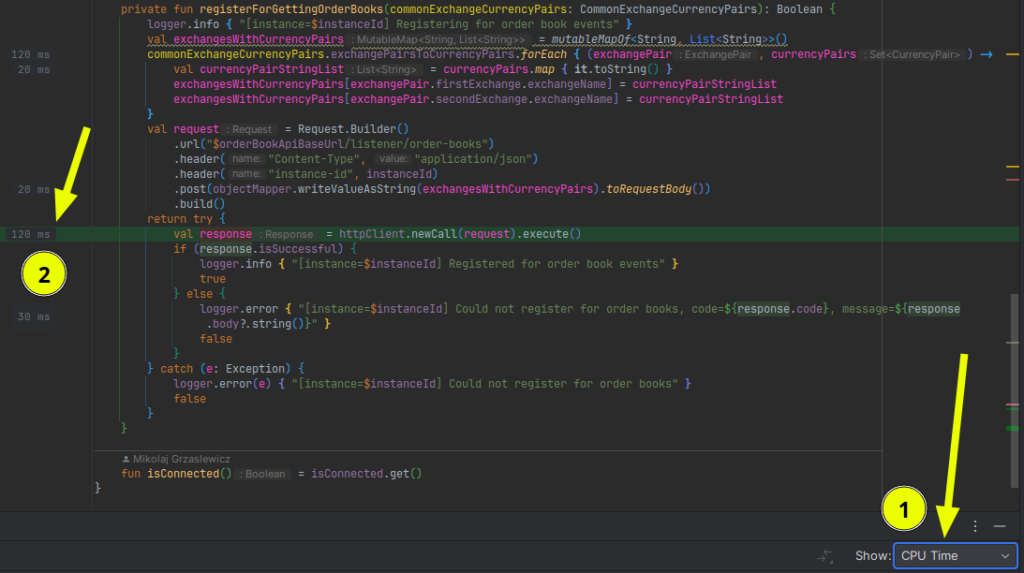
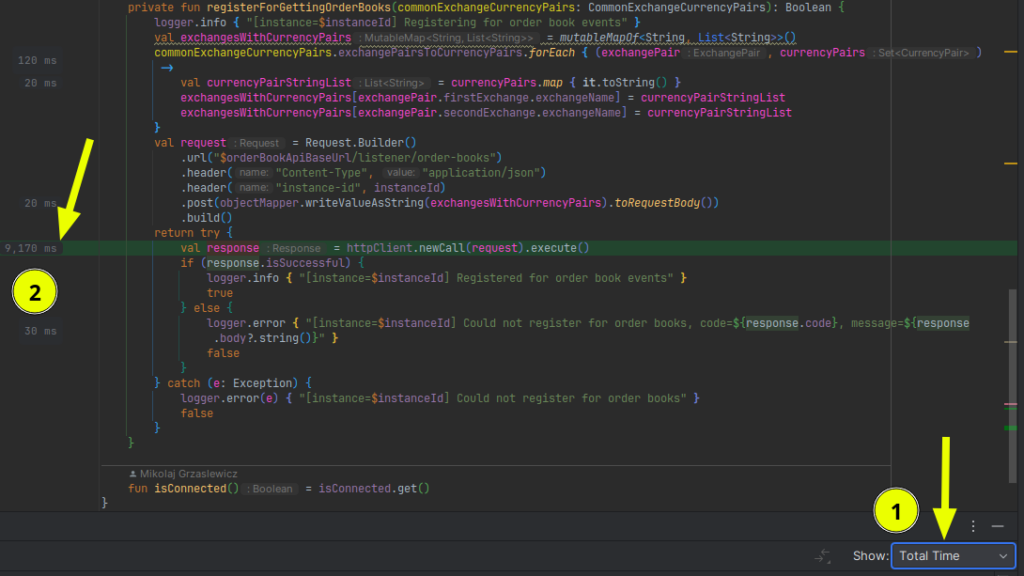
In the examples above you can see hot method httpClient.newCall(request).execute()
- Time spent measured with
CPU Timeis 120 ms - Time spent measured with
Wall Clock(Total Time) is 9170 ms
Would you optimize CPU time in this case? Probably not. You’d first focus on IO as it’s the bottleneck.
Subject to optimize needs to be chosen case by case. In order to have this choice, you need have both CPU Time and Total Time in flamegraph – and it’s available only when using wall clock mode sampling.

